> ## Documentation Index
> Fetch the complete documentation index at: https://botpress-pb-update-api.mintlify.site/llms.txt
> Use this file to discover all available pages before exploring further.
# Debug with logs and traces
> Inspect traces, spans, and logs to understand what your agent is doing.
The ADK provides two observability views in the dev console and a CLI command for reading logs.
## Traces
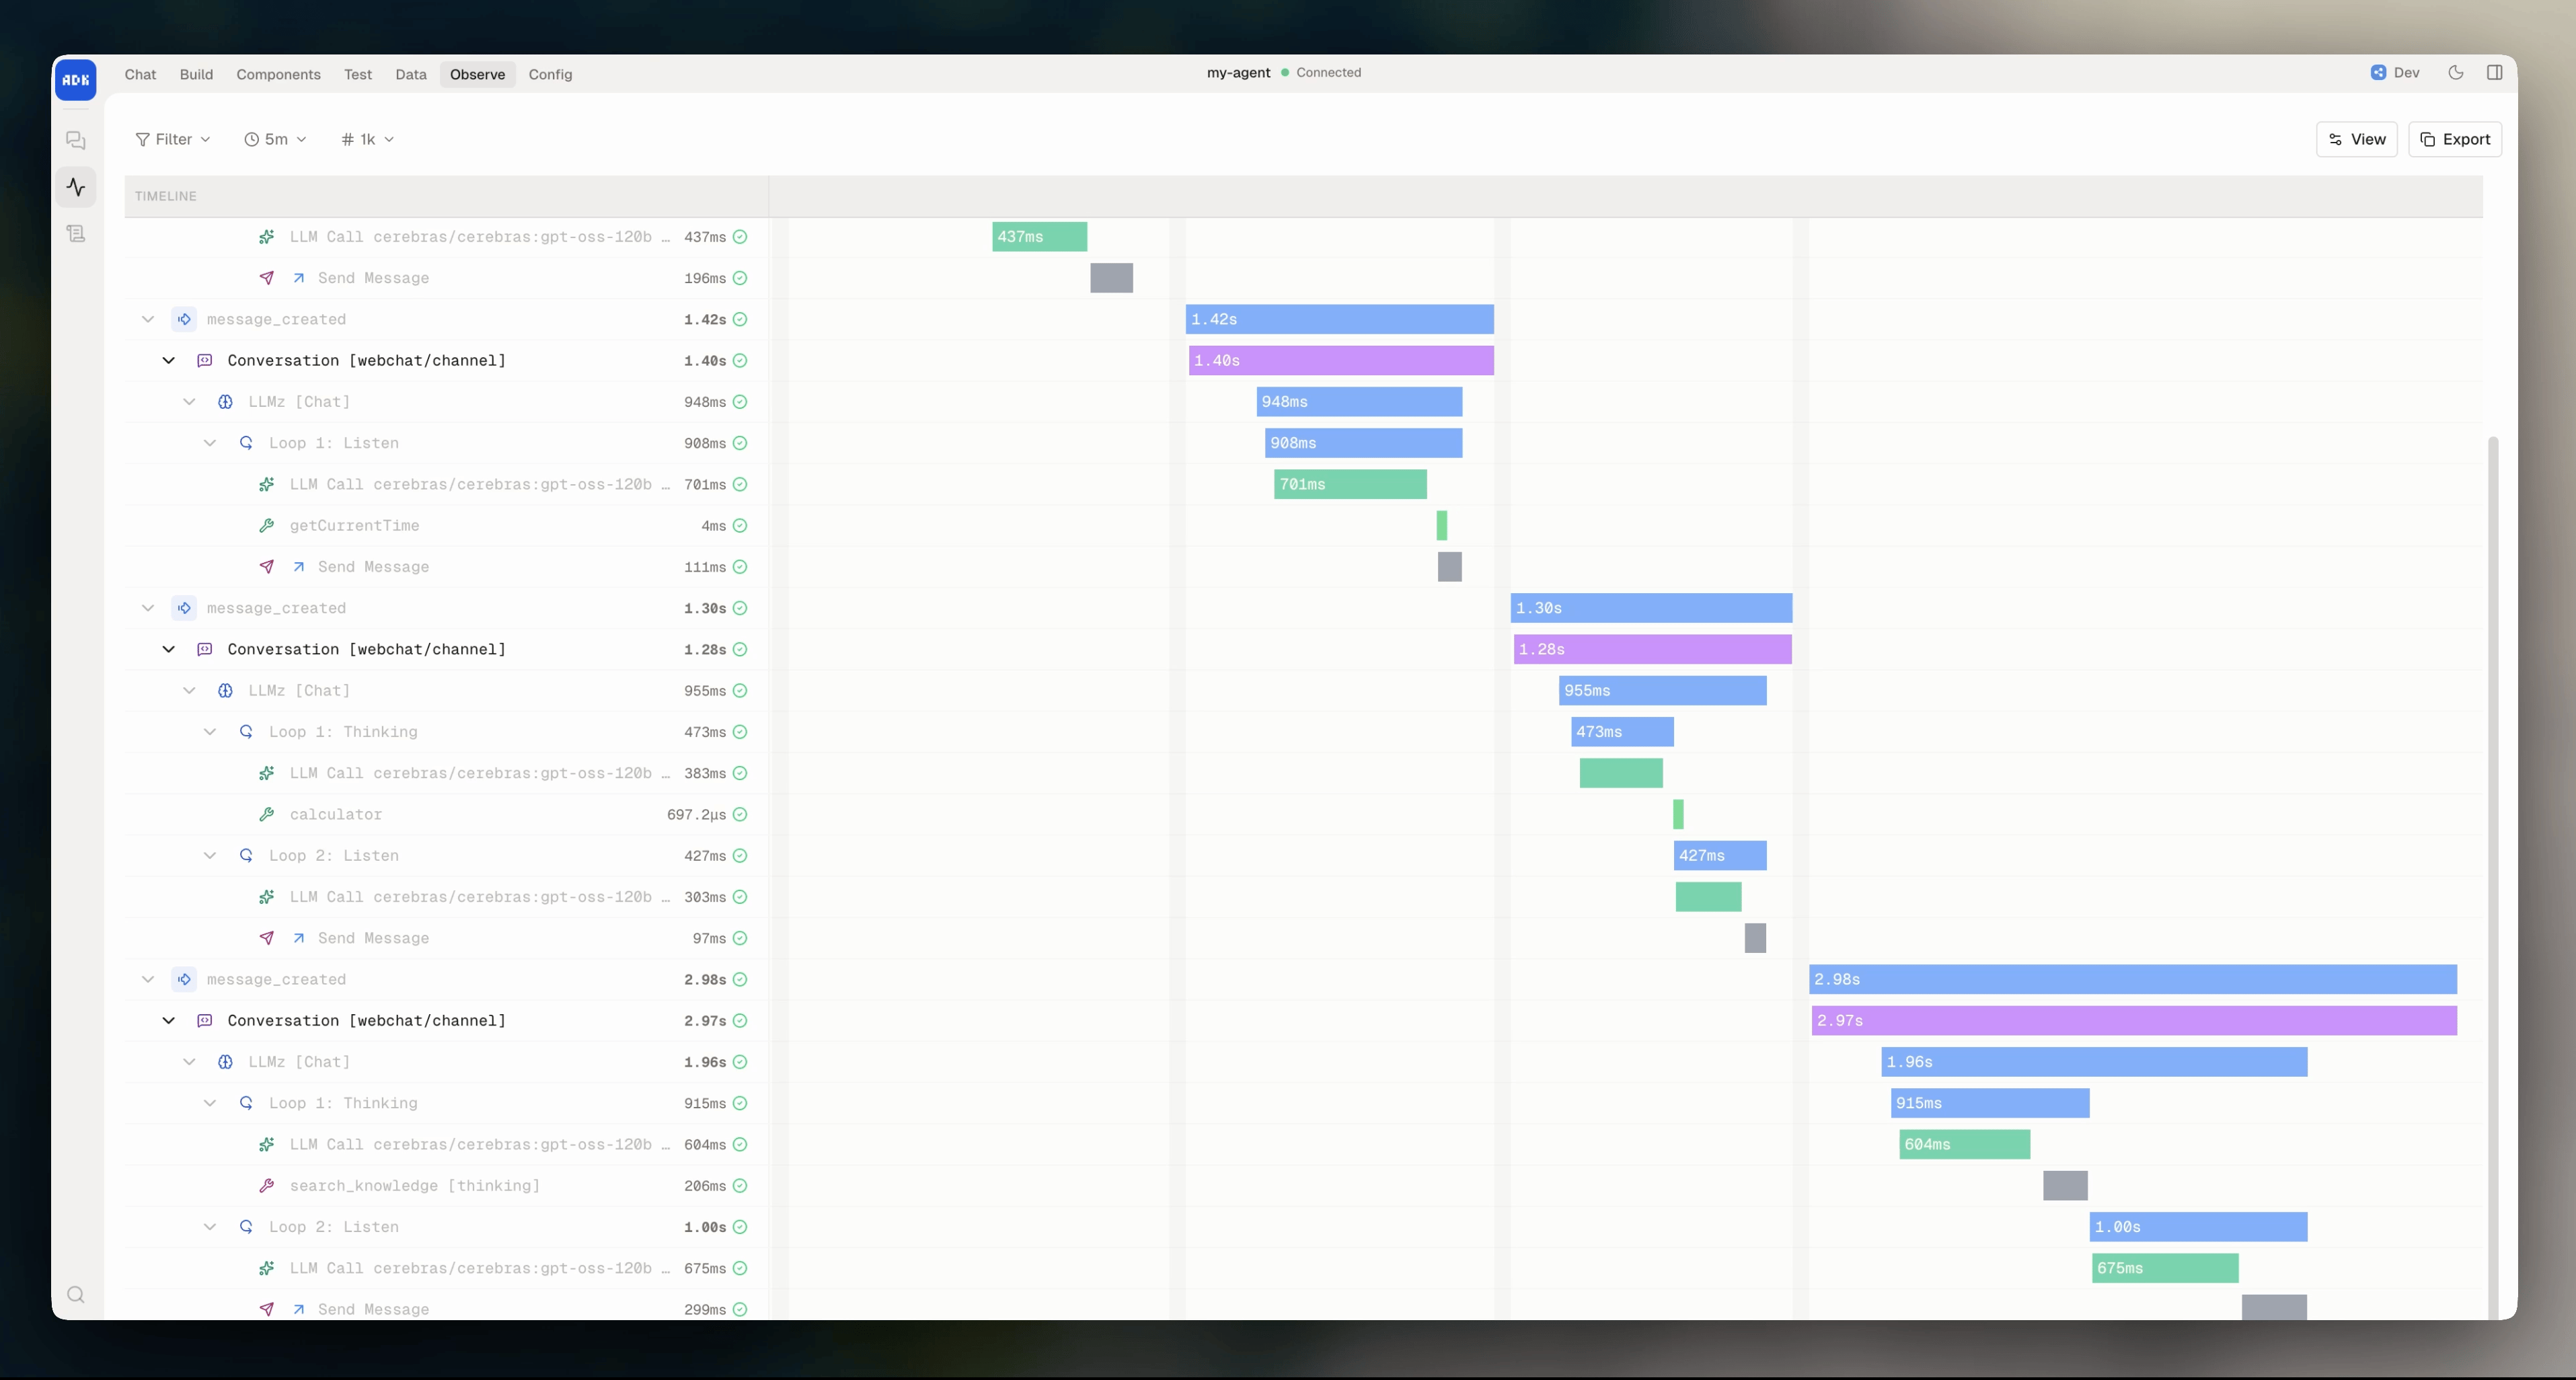
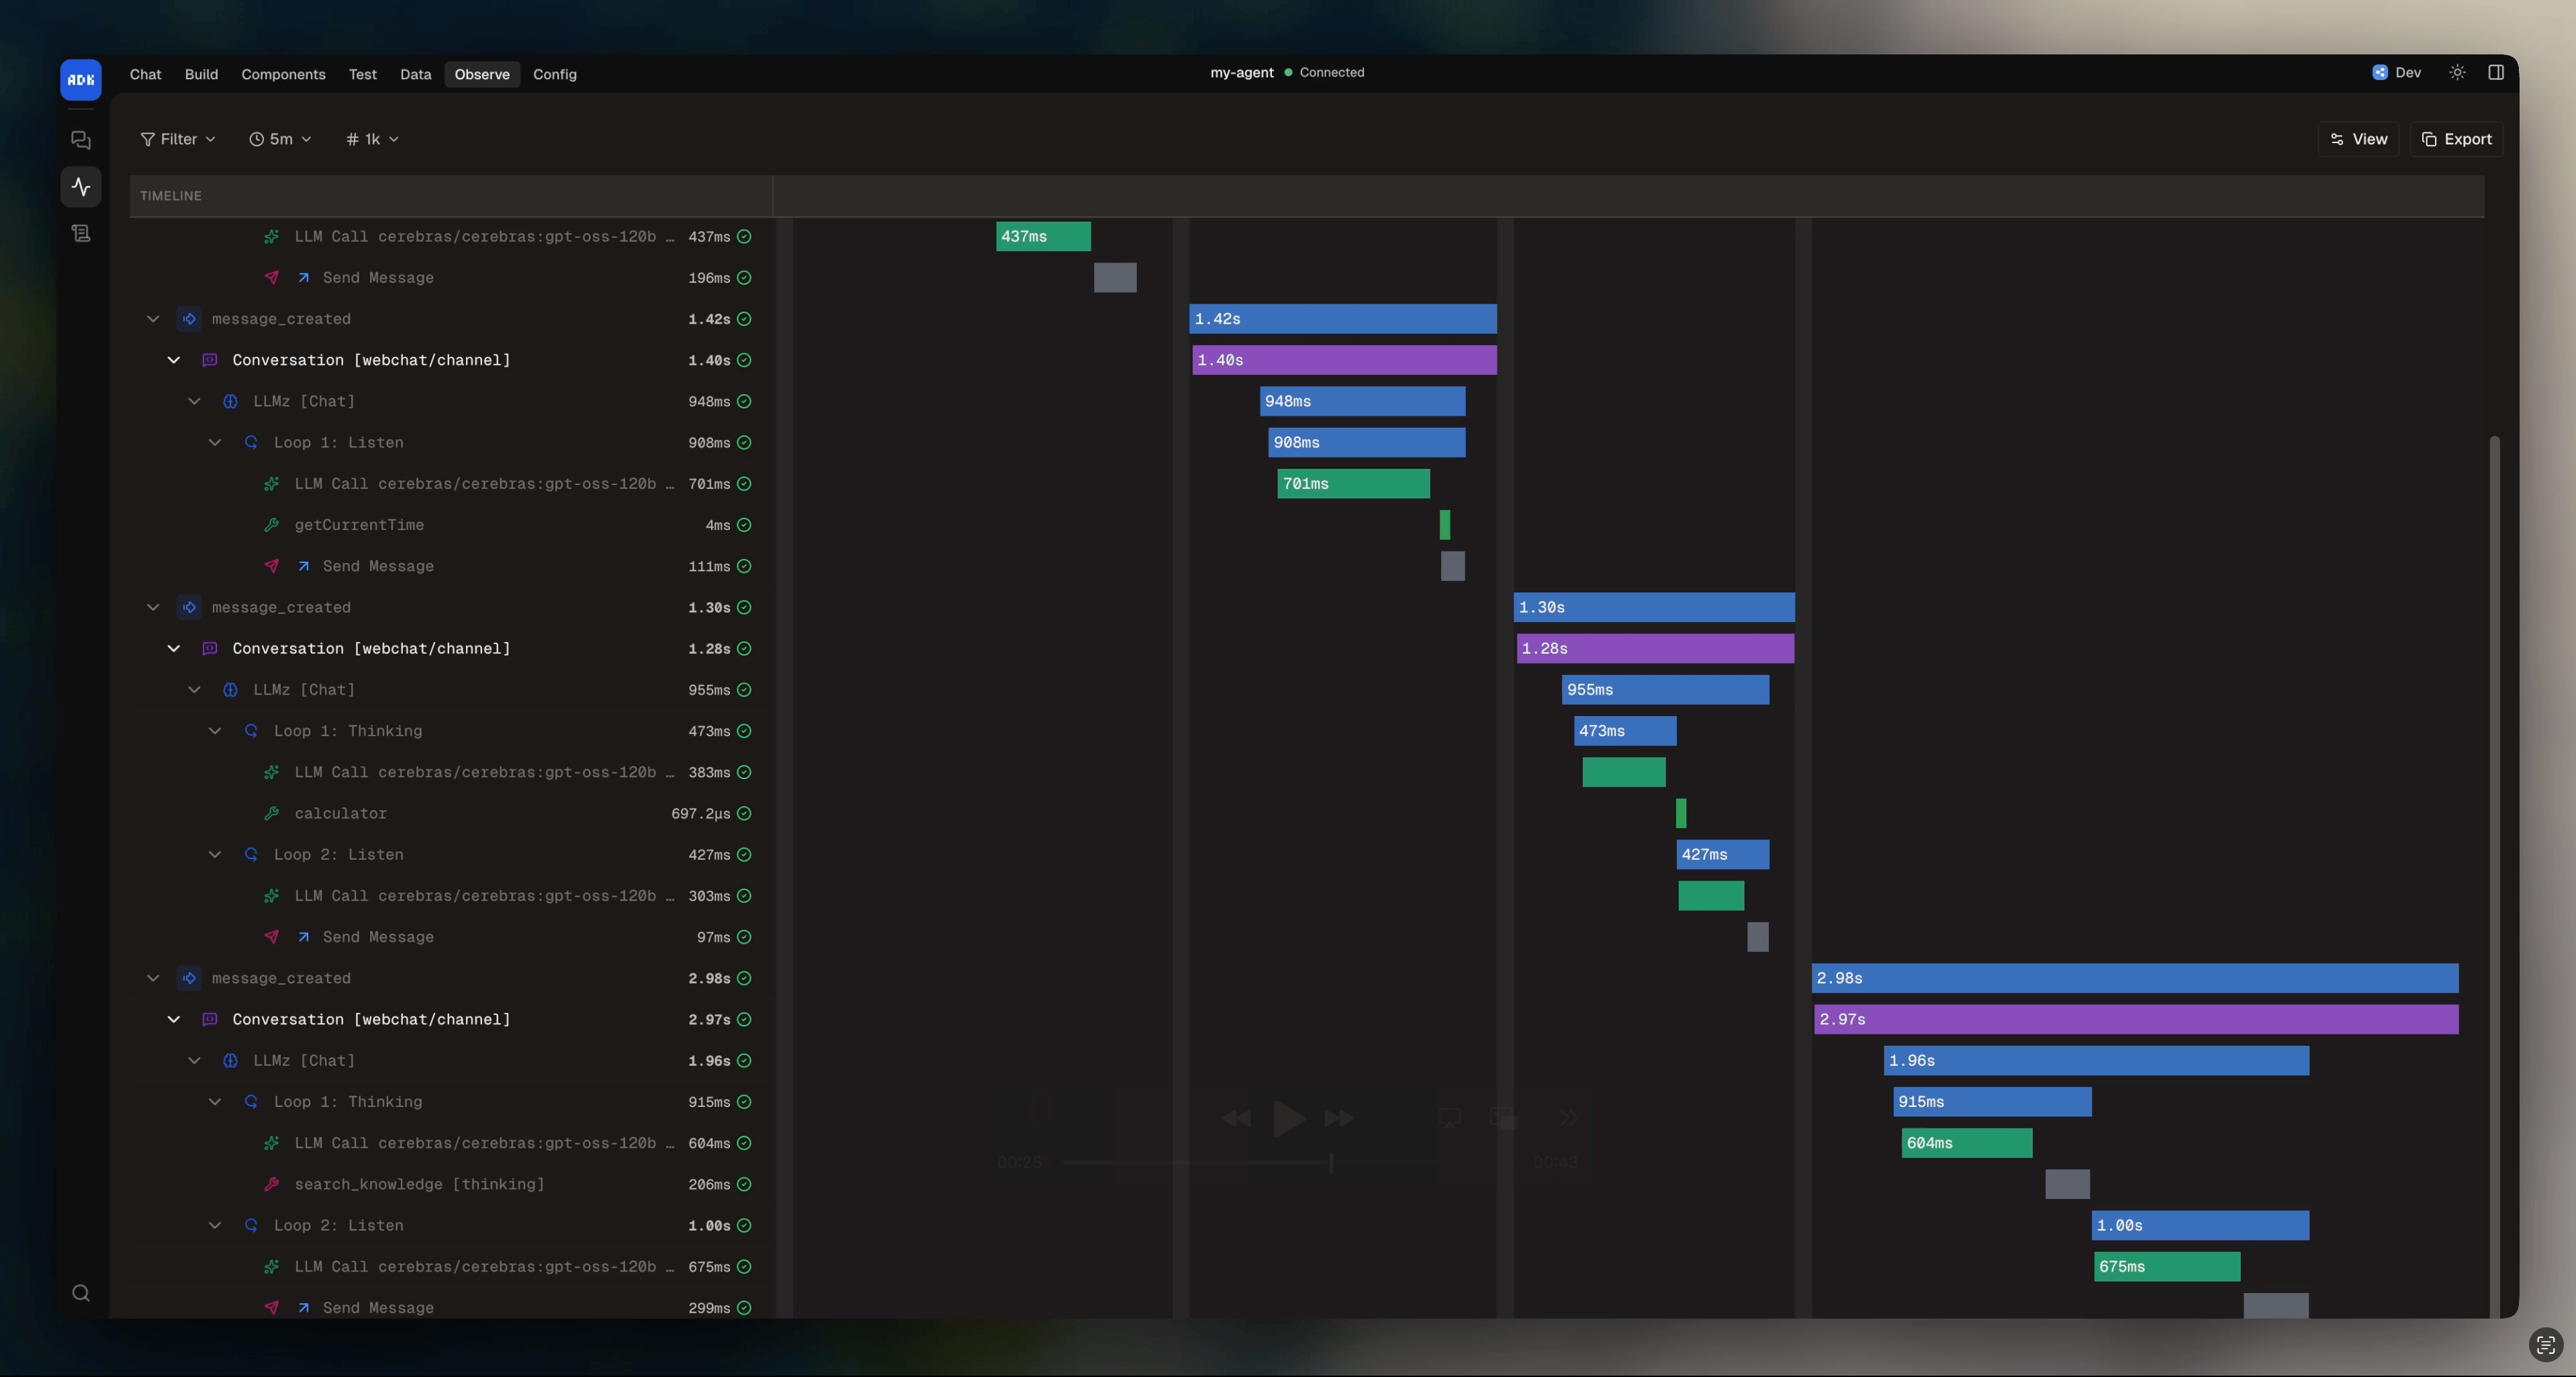
The **Traces** view in the dev console shows a timeline of every span in your agent's execution. Each conversation turn, workflow step, tool call, and LLM request is captured as a span with timing and metadata.
 ### What you can see
* **Handler spans** showing conversation and workflow handler execution
* **Autonomous execution** spans for each `execute()` call, including iteration count and model used
* **Tool call spans** with input, output, and duration
* **LLM call spans** with model, token usage, and latency
* **Knowledge search spans** with queries and result counts
* **Error spans** with stack traces
### Filtering
Filter traces by time range, span type, or search for specific content. Click any span to expand its details and see its child spans.
## Logs
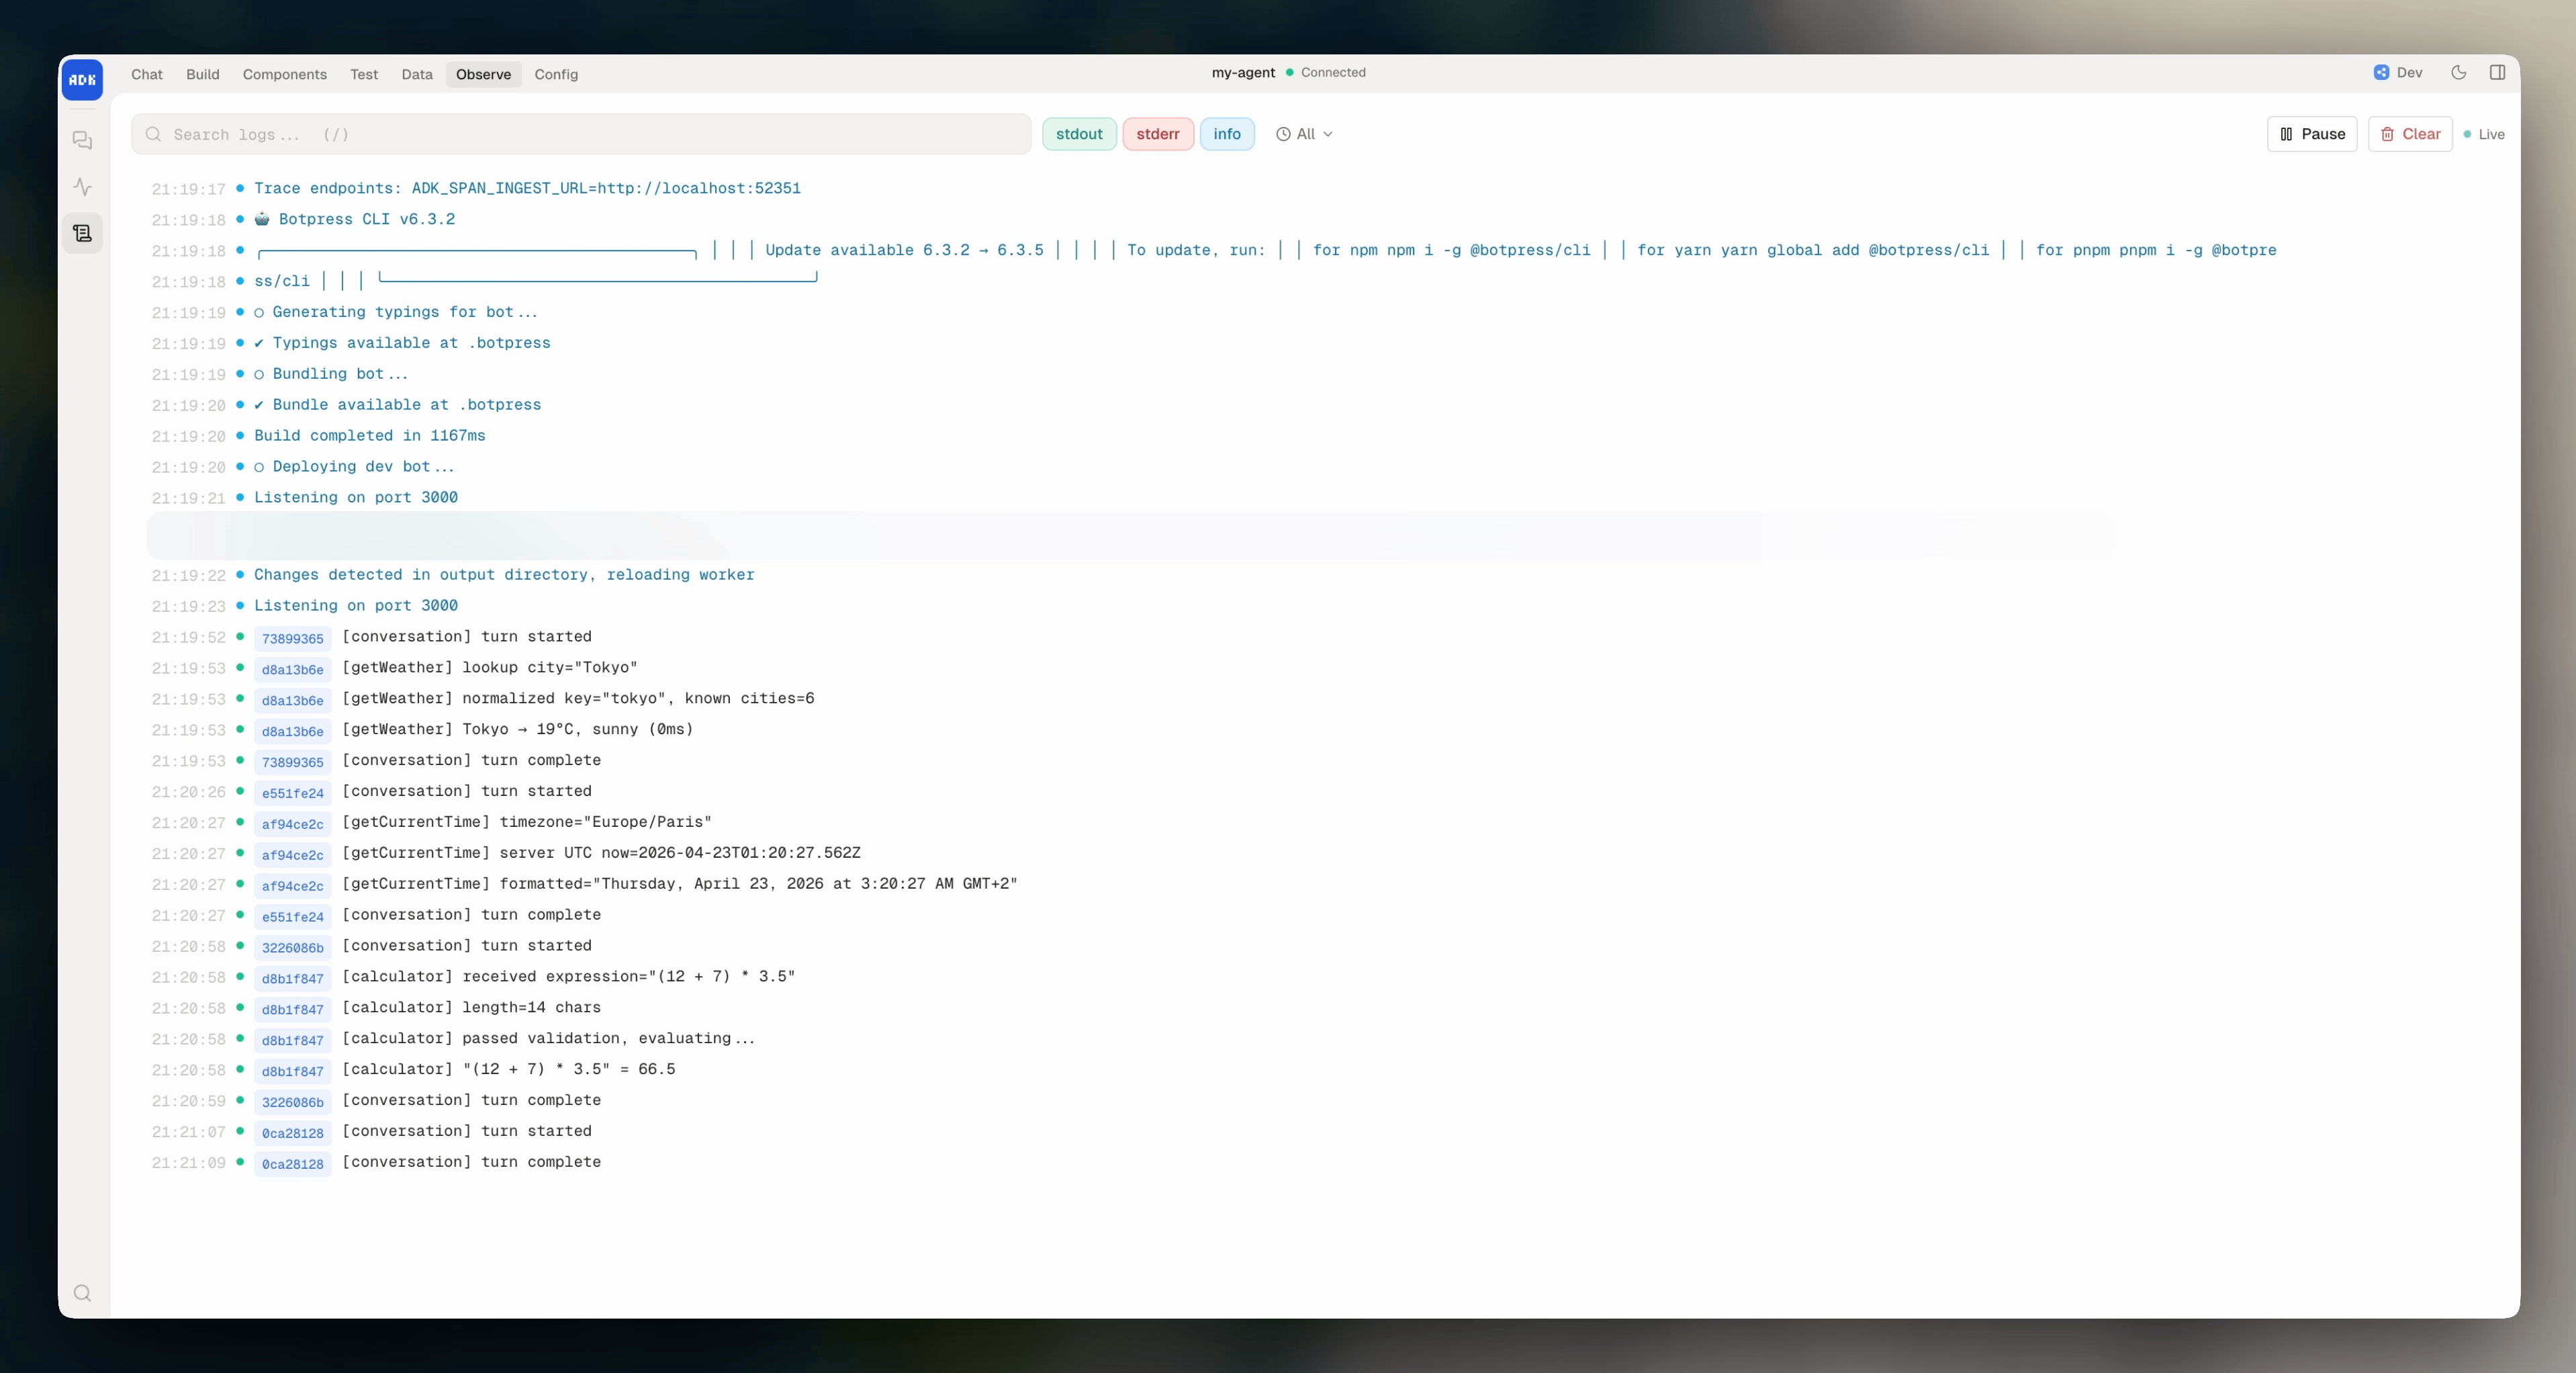
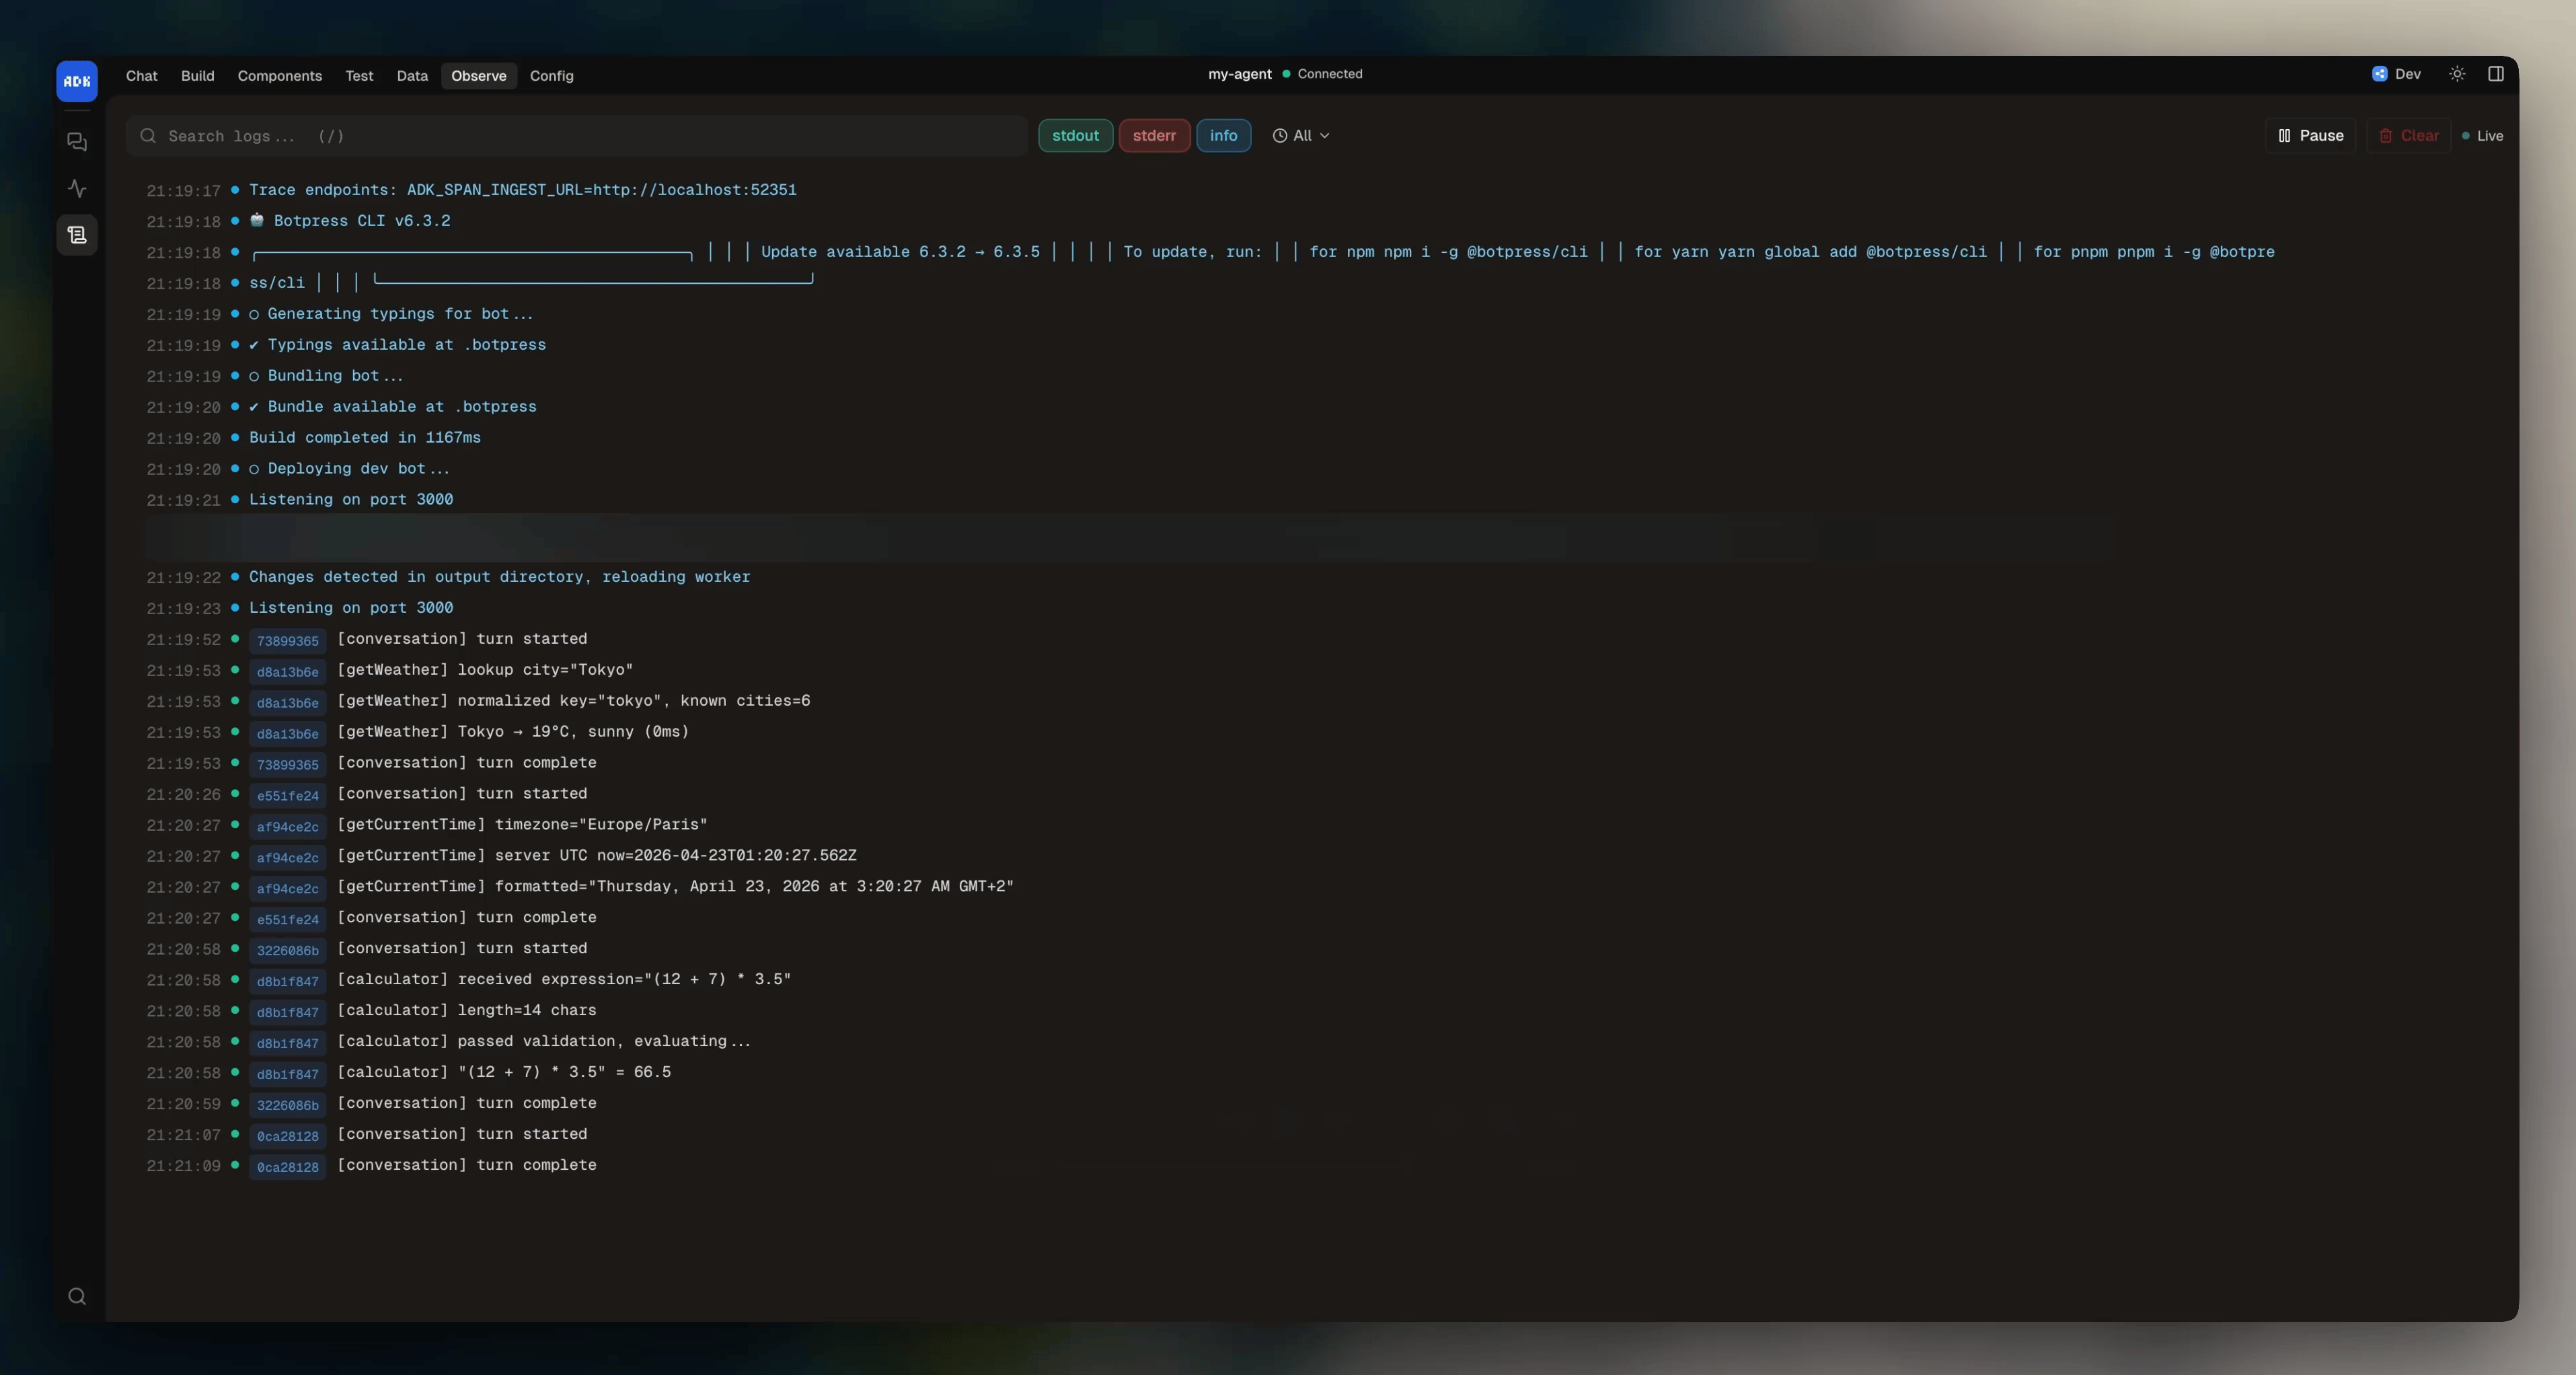
The **Logs** view in the dev console shows structured log output from your agent. Any `console.log`, `console.warn`, or `console.error` from your handlers, tools, and actions appears here.
### What you can see
* **Handler spans** showing conversation and workflow handler execution
* **Autonomous execution** spans for each `execute()` call, including iteration count and model used
* **Tool call spans** with input, output, and duration
* **LLM call spans** with model, token usage, and latency
* **Knowledge search spans** with queries and result counts
* **Error spans** with stack traces
### Filtering
Filter traces by time range, span type, or search for specific content. Click any span to expand its details and see its child spans.
## Logs
The **Logs** view in the dev console shows structured log output from your agent. Any `console.log`, `console.warn`, or `console.error` from your handlers, tools, and actions appears here.
 ### CLI
You can also read logs from the command line:
```bash theme={null}
adk logs # Show recent logs
adk logs --follow # Stream logs in real time
adk logs error # Errors only
adk logs warning since=1h # Warnings and errors from the last hour
adk logs limit=100 # Last 100 entries
```
The positional filter tokens are `error` / `warning` / `info` (cumulative level), `since=`, and `limit=`. See the [CLI reference](/adk/cli-reference#adk-logs) for all flags.
Logs are stored in `.adk/logs/` while the dev server is running.
### CLI
You can also read logs from the command line:
```bash theme={null}
adk logs # Show recent logs
adk logs --follow # Stream logs in real time
adk logs error # Errors only
adk logs warning since=1h # Warnings and errors from the last hour
adk logs limit=100 # Last 100 entries
```
The positional filter tokens are `error` / `warning` / `info` (cumulative level), `since=`, and `limit=`. See the [CLI reference](/adk/cli-reference#adk-logs) for all flags.
Logs are stored in `.adk/logs/` while the dev server is running.